Analytics
Analytics overview
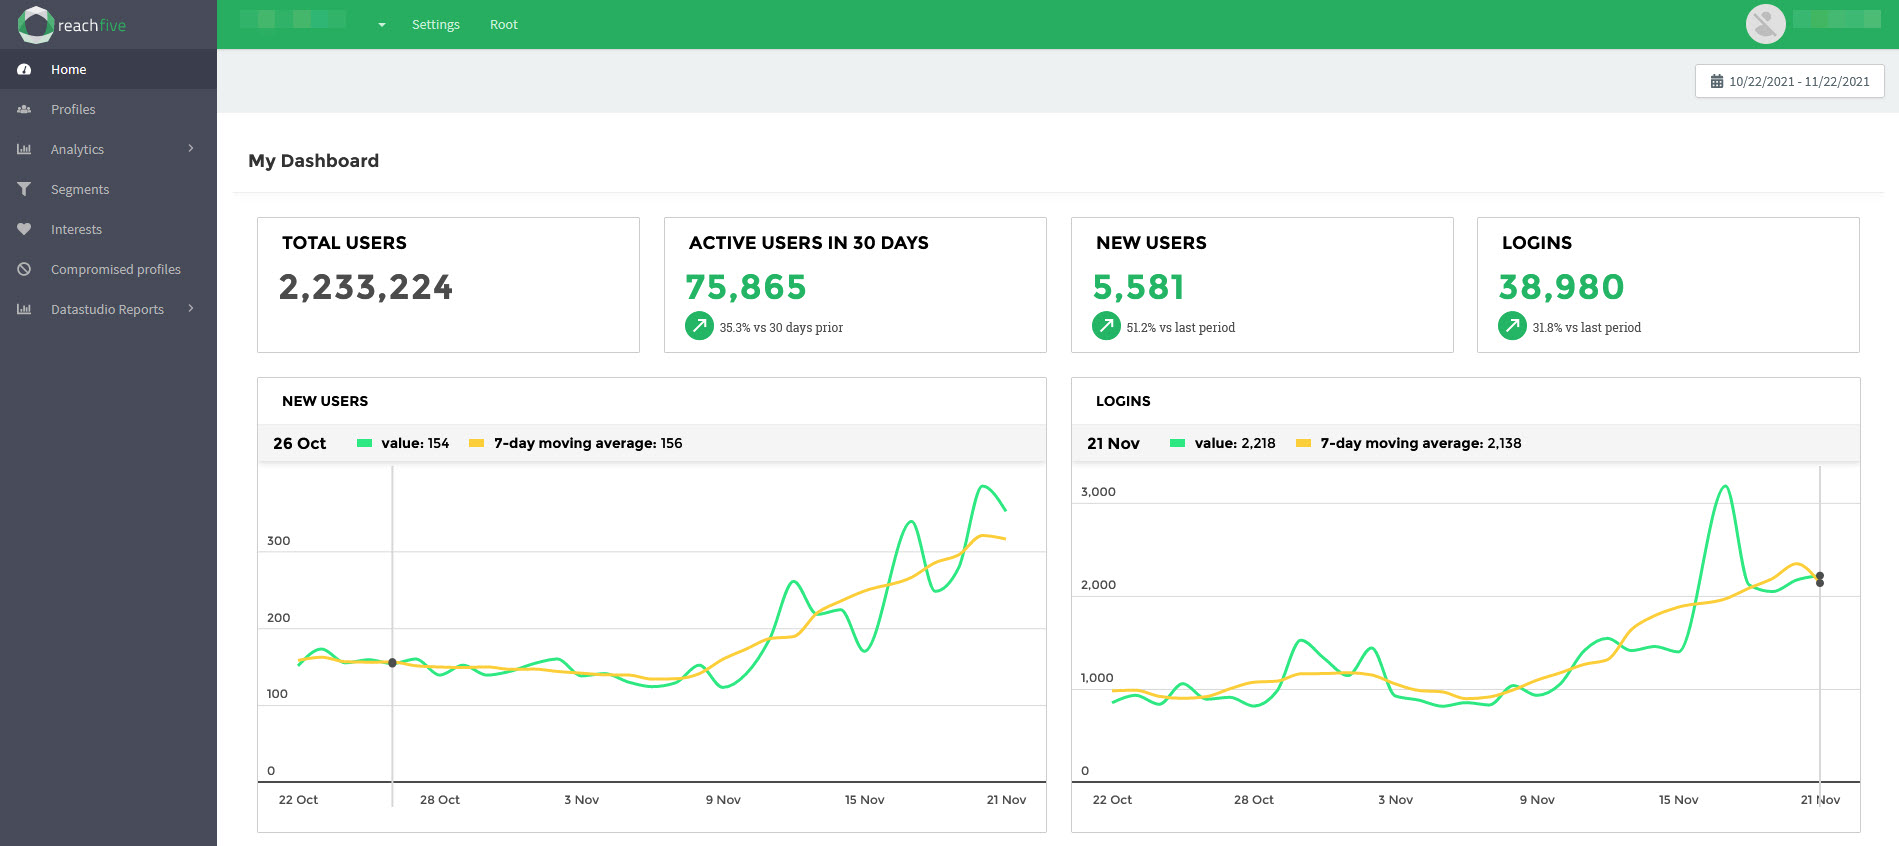
When you log in to your ReachFive Console, your home page displays My Dashboard which gives you an overview for your users and the subpages for analytics which include data like login totals, user age, authentication types, and more.
| If you are still seeing the old analytics or no analytics at all, please contact your ReachFive contact to enable the analytics module. |
What is displayed?
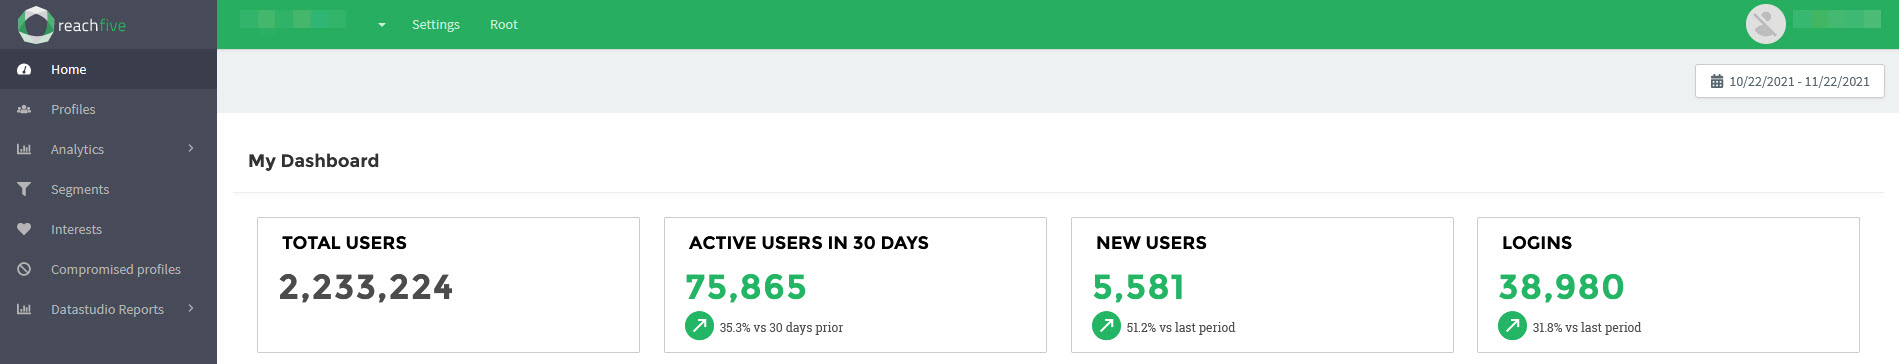
My Dashboard has a top row that captures high level user information such as:
| Item | Description | ||
|---|---|---|---|
Total Users |
This displays the total number of users for your deployment across all sites. |
||
Active Users (30 days) |
This displays the number of unique users that were active in the last 30 days. This includes any event associated with a unique user ID across 1st party, 3rd party, and legacy clients. Only calls to our Identity API are counted in the Active Users category. Calls made from the Management API such as LITE profiles are not counted in the Active Users category.
|
||
New Users |
This display the number of new users based on the selected timeframe. A new user is a user that has a |
||
Logins |
This displays the number of user logins based on the selected timeframe.
|
||
New users + Logins |
This displays the number of new users and logins based on the selected timeframe.
|
Analytics pages
Currently, we have 5 analytics subpages on the ReachFive Console:
| Page | Description |
|---|---|
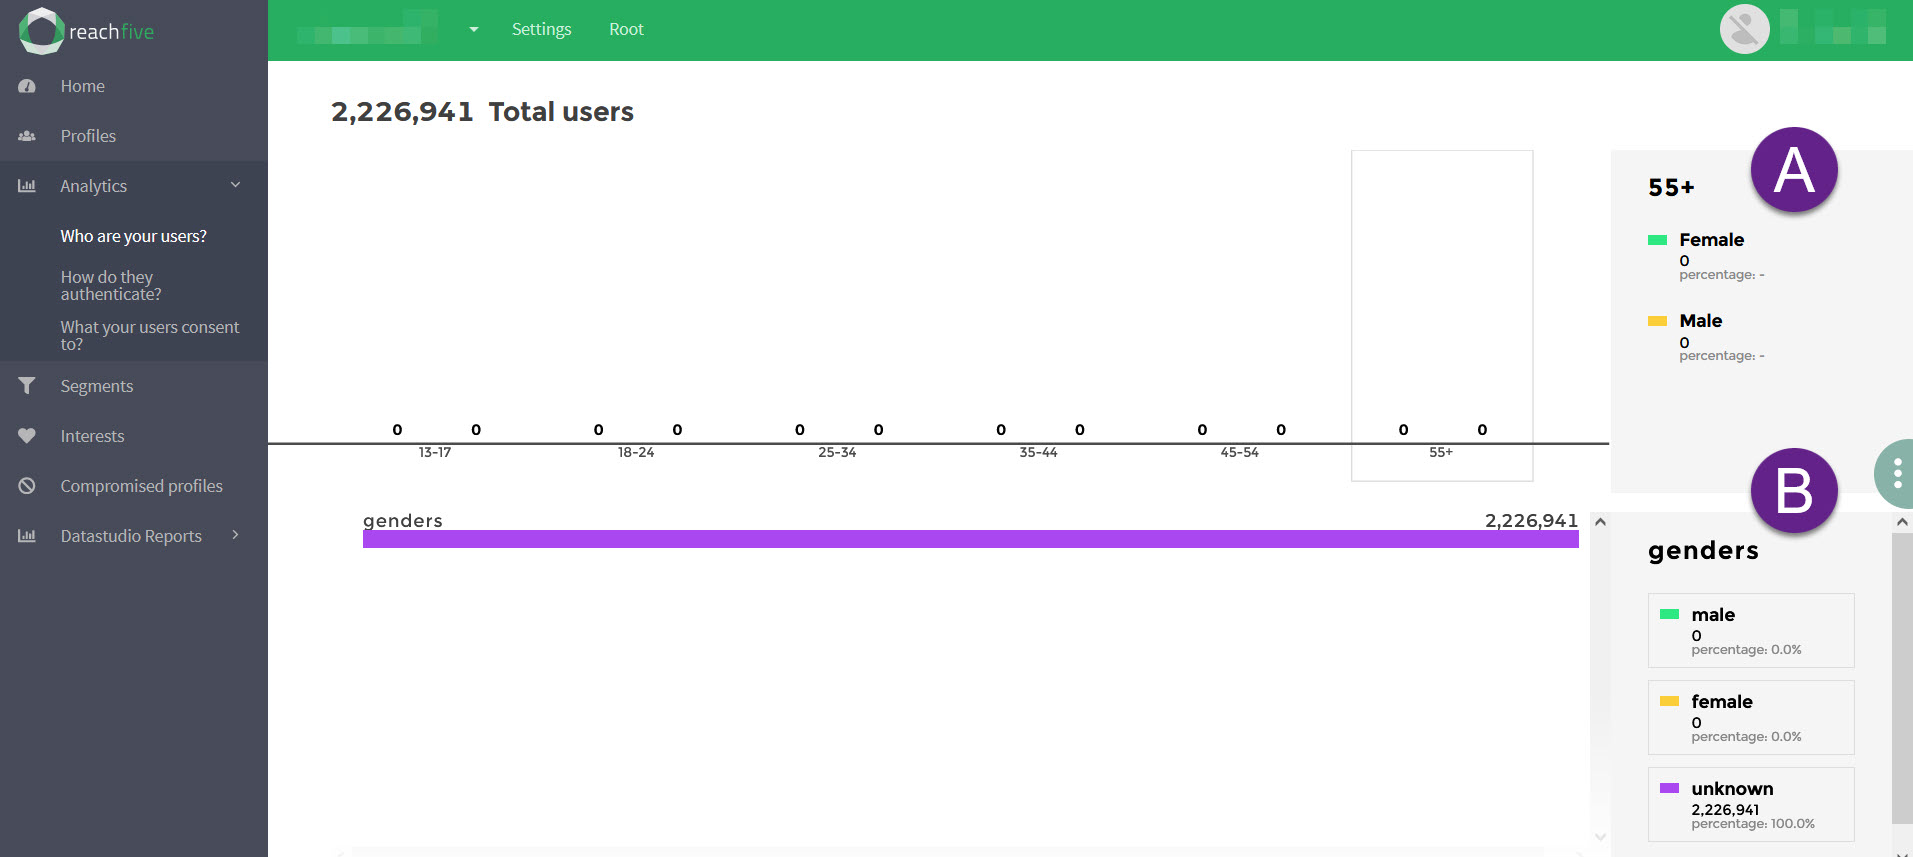
Displays demographic information about your users such as age, gender, etc. |
|
Displays the different methods your users are using to authenticate over time. |
|
Displays your user’s browser usage when they authenticate, manage their passwords, and/or verify or update their email or phone number. |
|
Displays your user’s device usage when they authenticate, manage their passwords, and/or verify or update their email or phone number. |
|
Displays a global view to exactly what your users are consenting to. |
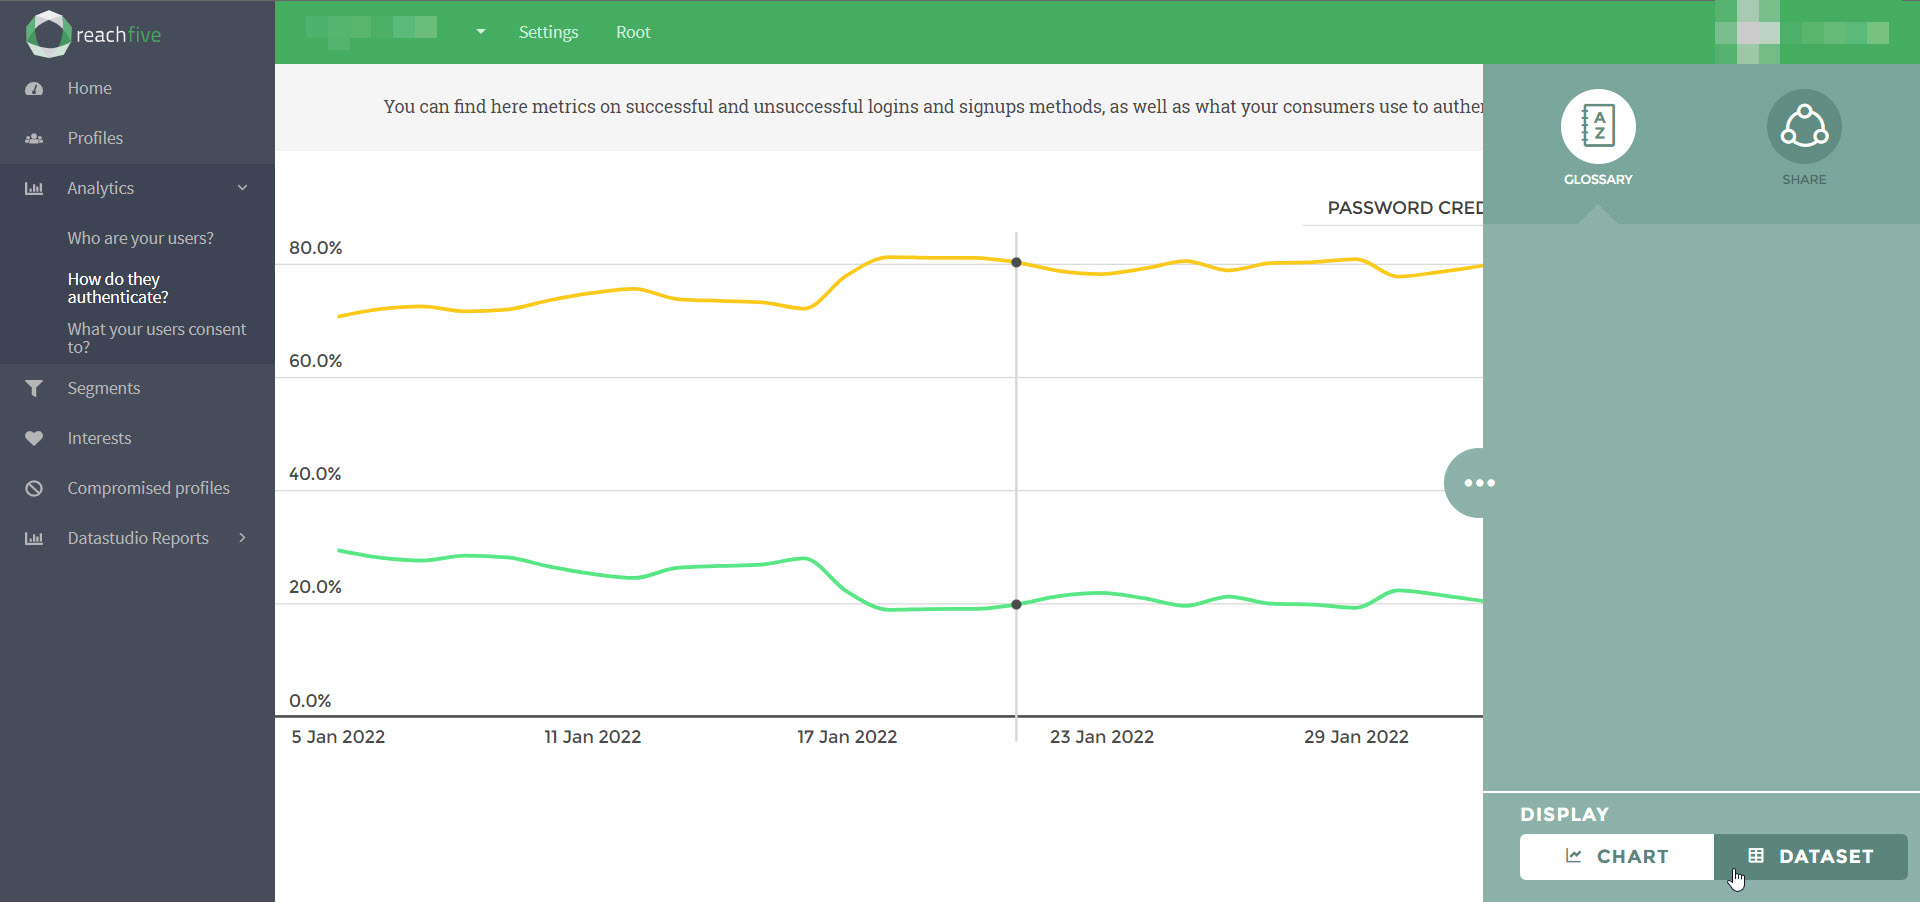
How do they authenticate?
To access this page, go to on your ReachFive Console.
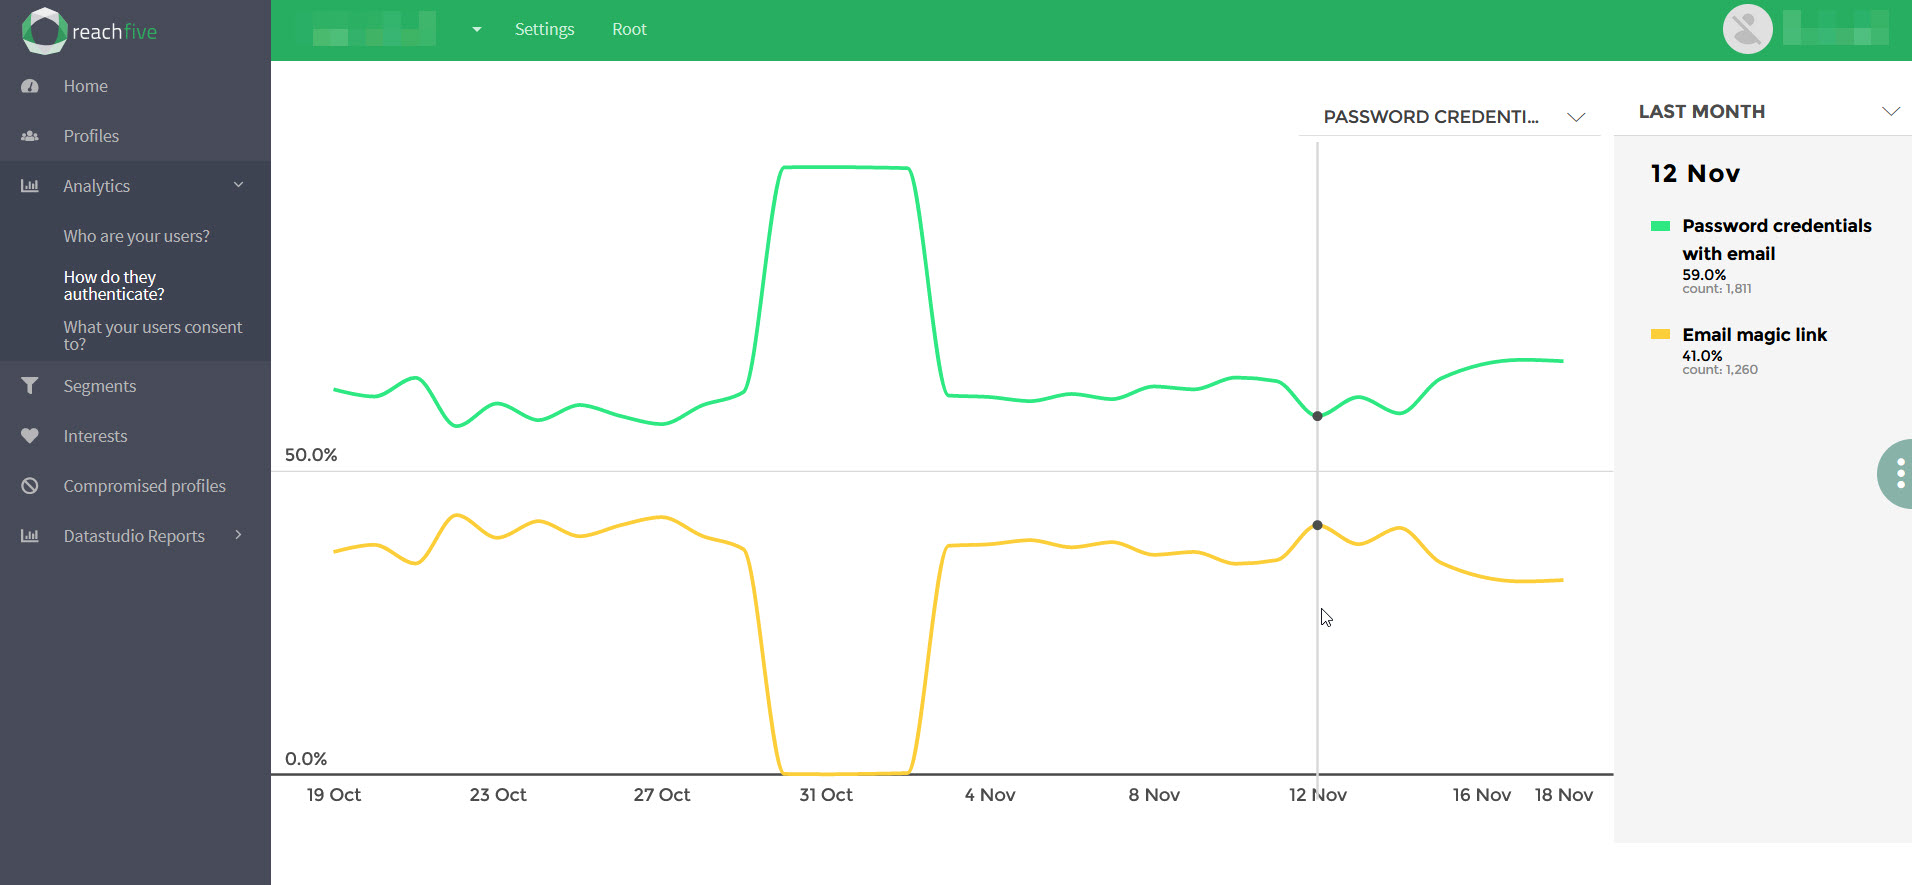
How your users are authenticating. It includes all events except those that have an auth_type of null or refresh. This means that all events that require explicit authentication actions from the user including (un)successful signups, logins, as well as passwordless and MFA-related events. Users authenticating via a refresh token are not counted.
You can filter by date and method using the tools on the analytics page.
What browser do they use?
To access this page, go to on your ReachFive Console.
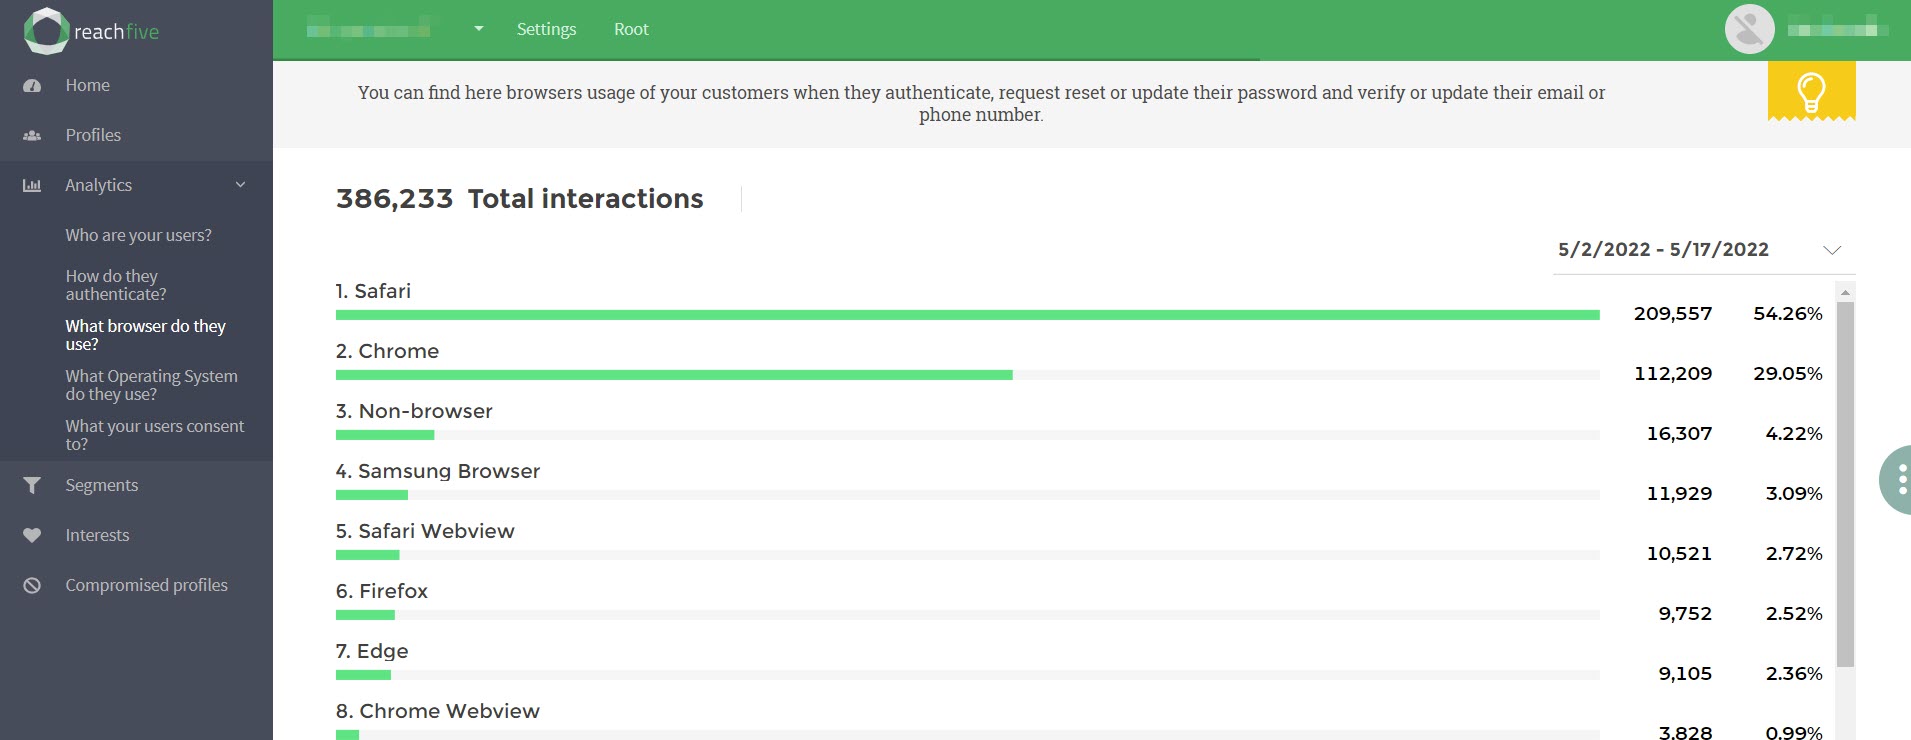
The different browsers used to connect to your application. For example, Safari, Chrome, and Firefox. This is based off of certain events occurring within the browser:
-
login -
signup -
phone_number_verified -
email_verified -
password_reset_requested -
unlink -
email_updated -
phone_number_updated -
password_changed
You can filter by date and timeframe using the tools on the analytics page.
What Operating System do they use?
To access this page, go to on your ReachFive Console.
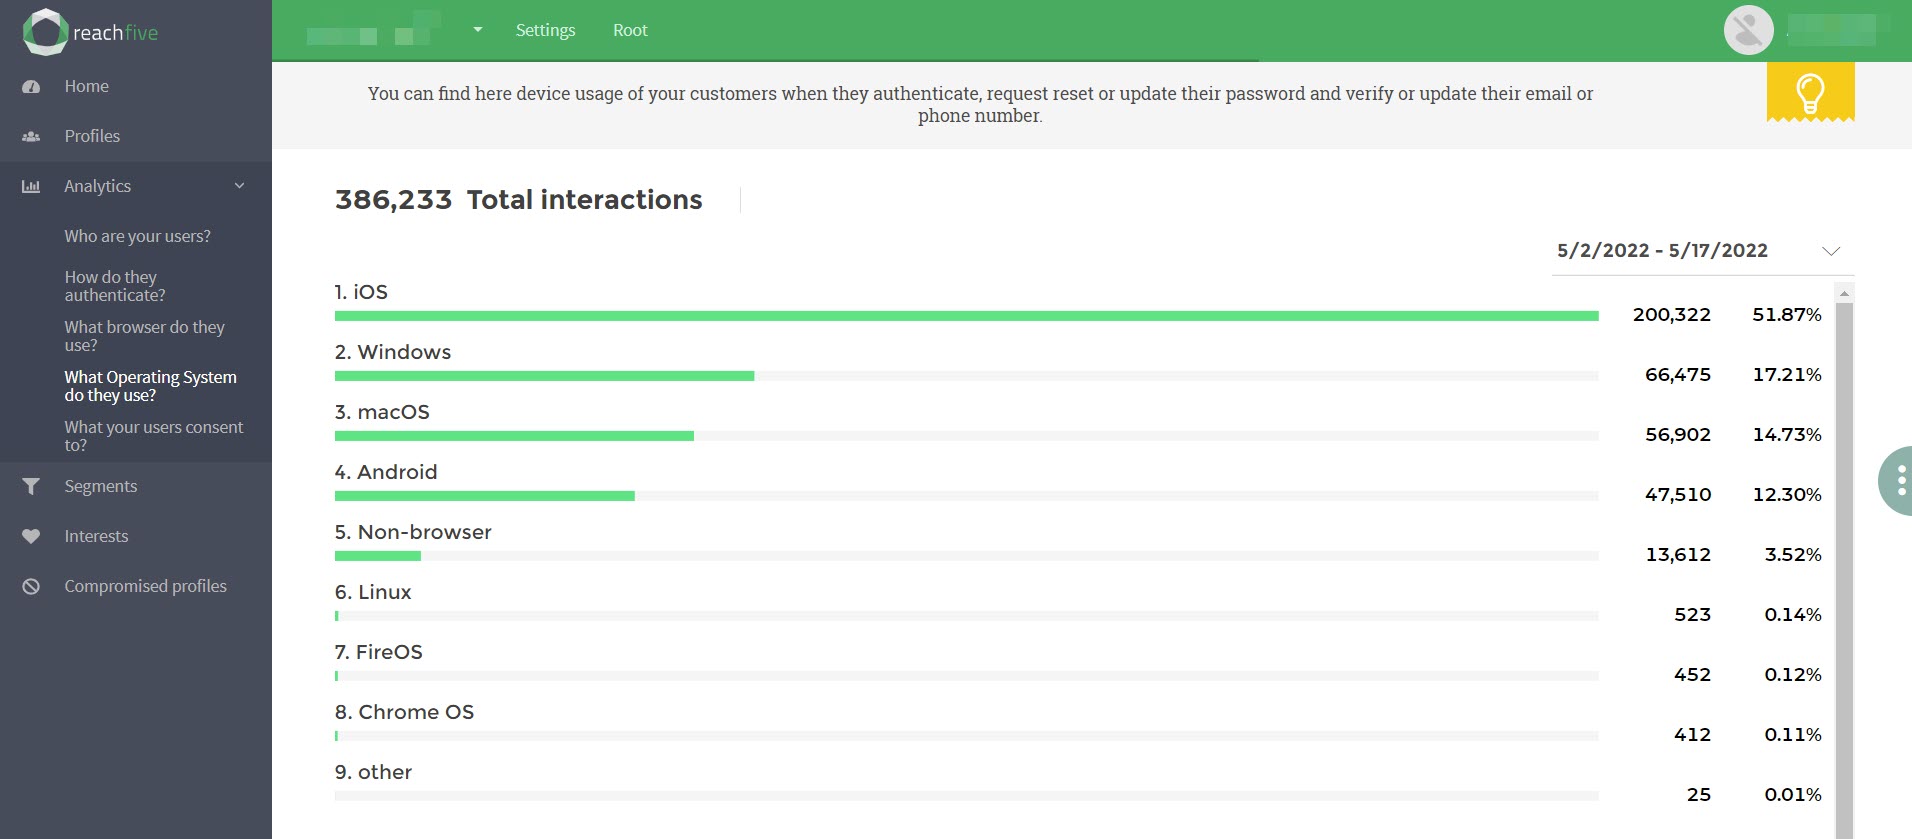
The Operating Systems (OS) that your users are accessing your application with. For example, via or . This is based off of certain events occurring within the OS.
-
login -
signup -
phone_number_verified -
email_verified -
password_reset_requested -
unlink -
email_updated -
phone_number_updated -
password_changed
You can filter by date and timeframe using the tools on the analytics page.
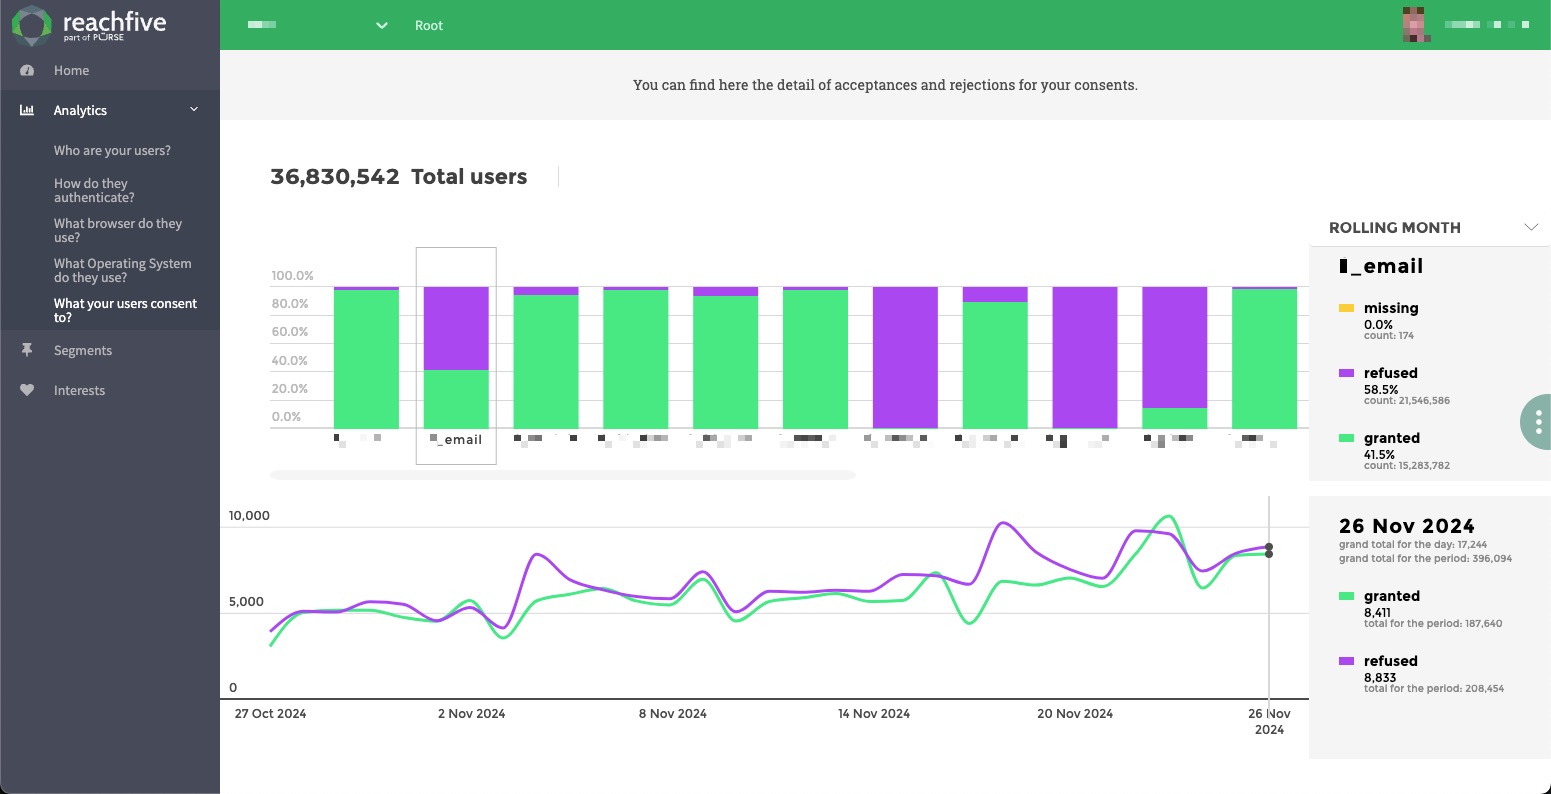
What do your users consent to?
To access this page, go to on your ReachFive Console.
What your users are consenting to, including what consents are granted and refused over a period of time.
This is based on the Consents that you have configured as part of your ReachFive integration.
Use analytics tools
Our analytics provide some handy tools when interacting with your customer data.
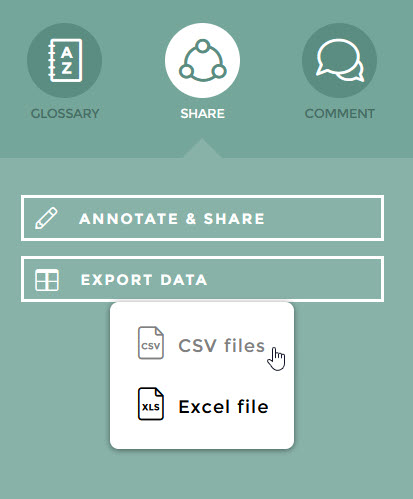
Sharing data
One of the handy tools is the ability to annotate and share or simply export your data via csv or excel.
To do this:
-
Go to the analytics page that you want to share.
-
Click the slider to open the tools.
-
Click Share.
Next: annotate and share or export your data.
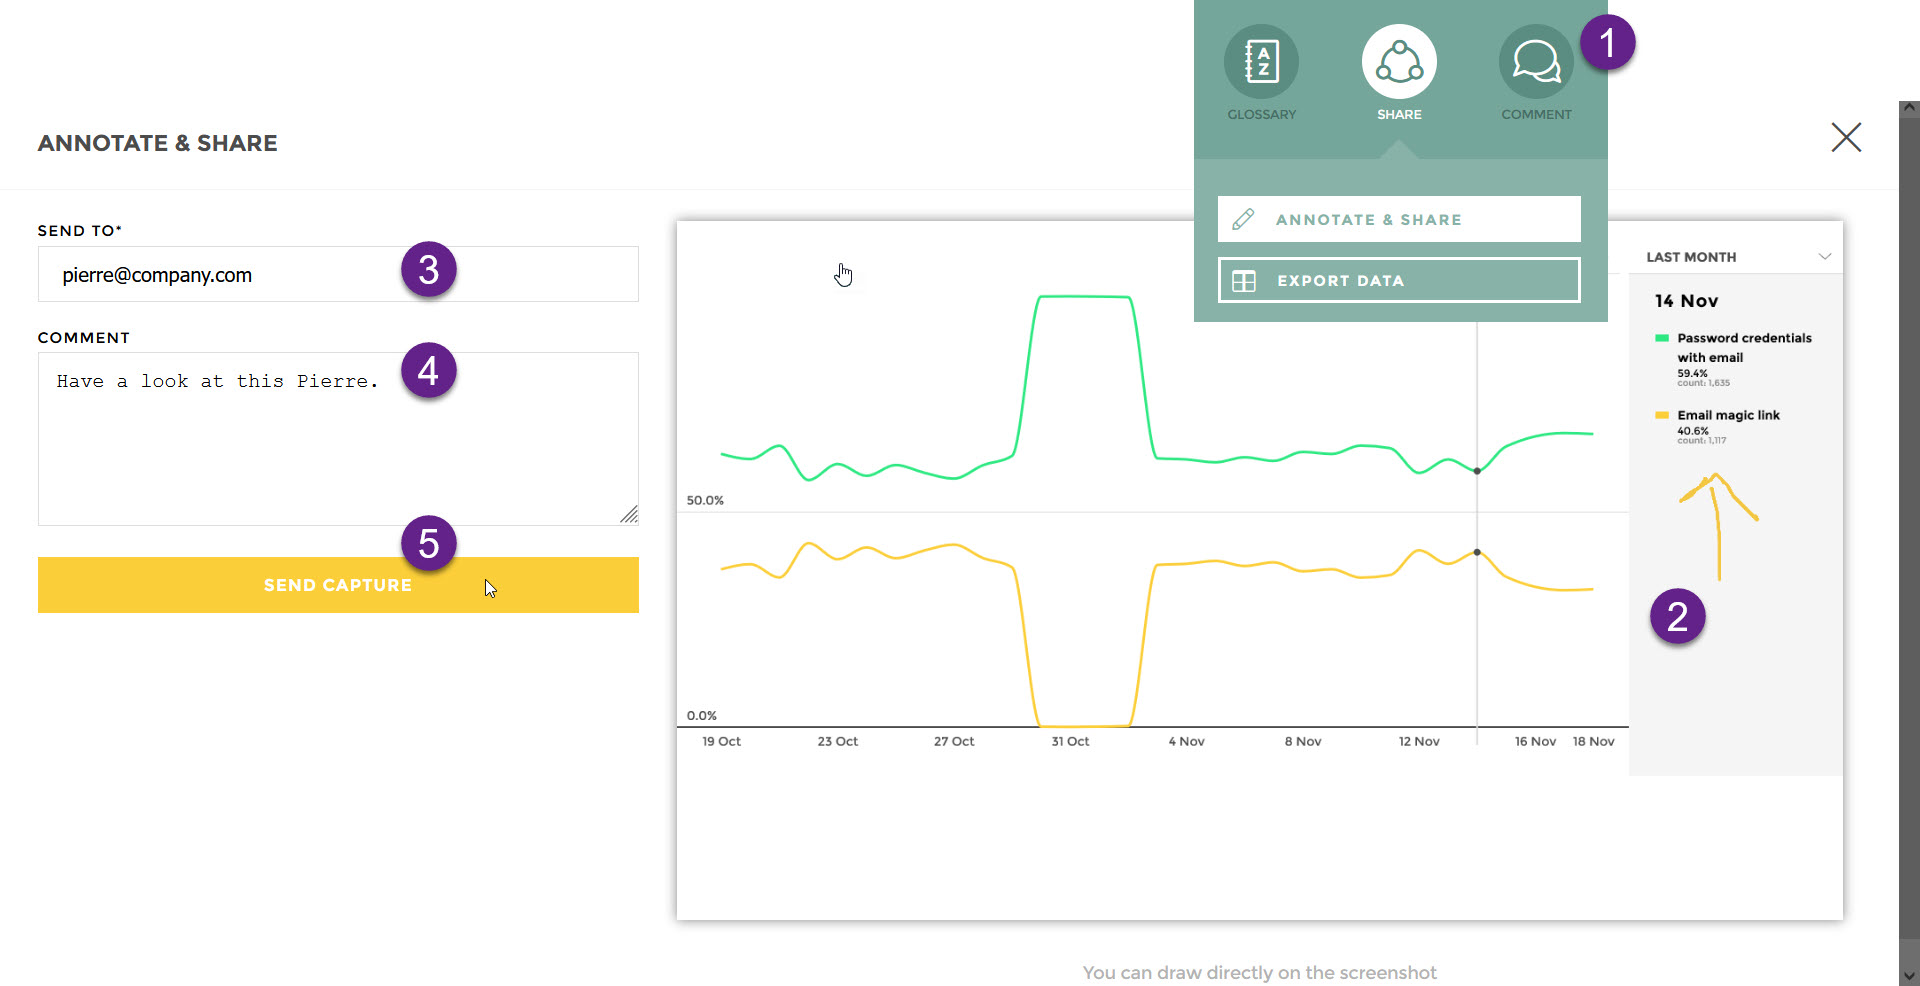
Annotate & Share
-
Click Annotate & Share.
-
Annotate (draw directly) on the screenshot. This highlights important information.
-
Add an email in the Send to field.
-
Add a comment in the Comment field. (optional)
-
Don’t forget to click Send Capture.
Voila! Your email recipient will have an annotated screenshot of your analytics page.